Pricing analytics is the foundation of any business-to-business pricing strategy, delivering crucial, highly visual, intuitive, and data-driven insight. The analysis of pricing data is essential to setting prices that meet the financial goals of an enterprise.
Pricing analytics provide key insights into which price changes to make, how those changes will affect margin, revenue, and volume, and how sales reps and customers will respond to different pricing strategies.
With such a sprawling set of capabilities, use cases and stakeholders, the umbrella term “pricing analytics” can cover many types of pricing analyses. This in-depth overview will deconstruct the concept, break it down into essential analytical capabilities, and illustrate the immense value B2B companies receive from pricing analytics adoption.

From boardroom meetings to sports debate shows, the concept of analytics can confound, confuse and frustrate. It doesn’t have to be this hard. Analytics is simply a study of the data that is important to your business. Stripped of all pretensions, pricing analytics use data to answer fundamental and critical questions related to pricing and margin such as:
- What is my current price performance?
- Where, precisely, is my business experiencing margin loss?
- How much will an increase in price impact volume?
- What behaviors are sales reps exhibiting with respect to price?
- What are my top 20 margin-driving accounts?
In this article, we will explore how different types of pricing analytics deliver insights to various stakeholders in an organization and what differentiates a best-in-class analytics approach.

What Are Some Key Pricing Analytics Scenarios?
Pricing analytics can broadly be bucketed into three categories: backward-looking, forward-looking and decision supporting. Sticking with our theme of simplicity, we can think of these categories as illuminating what has happened, what could happen and what should happen. These are the overarching questions that pricing analytics provide the answer to, and which lead users to making the right call on pricing strategy.
Descriptive Analytics (Backward-looking)
Taking the first step with descriptive analytics – or applying pricing analytics to historical business data – is a massive value-add. B2B companies, particularly those with a proliferation of products and customers, often have difficulty gaining a complete view of how historical prices have impacted their business, or determining the cause of suspected or apparent issues.
Conduct an informal self-evaluation with these questions:
- Have you made a recent price change and need to demonstrate to company leadership how it’s performing in-market?
- Can you rapidly find the answers to which customers are accepting the change, whether price exception requests are on the rise, or what percentage of your sales team is quoting the recommended price?
- Is there an internal issue in the way cost is being passed through?
- Are pricing agreements growing stale and need to be updated?
- Is there an external force like inflationary pressure or seasonality that is not being reflected in your latest prices?
New opportunities for improvement come to light quickly once a business gains a 360-degree view of historical pricing data.
For instance, a manufacturer might find that it’s been steadily losing price year-over-year in one or more product categories with its largest distribution customer. The analytics reveal just how much margin has been lost due to this price degradation, prompting management to push a price increase through on the next annual agreement.
In another distribution segment, the manufacturer might find that past price increases have caused volumes to drop amongst small and mid-tier distributors. That intel is used to guide more surgical, revenue-aggressive price changes to recapture that lost business.
What are Some Examples of Descriptive Pricing Analytics?
Price Waterfall
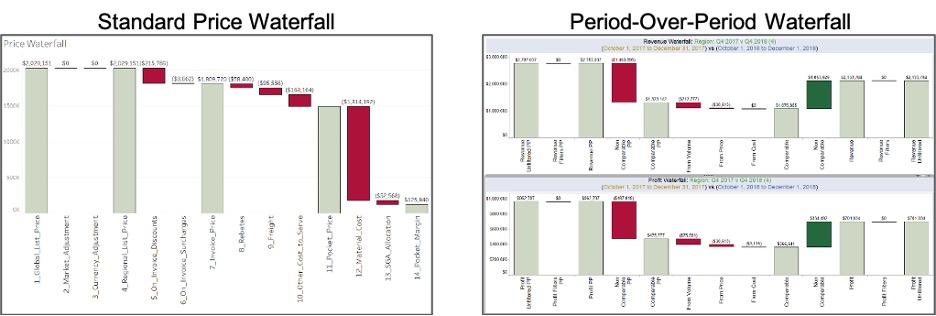
A price waterfall is a step-by-step visual depiction of how much money a company retains from each transaction. This price method makes it easy to discern and drill deeper into each cost factor throughout the value chain to uncover areas of margin leakage and arrive at a pocket price. Price waterfall charts can also give companies a holistic view of changes over any user-defined time period and what components are driving the change.
The price waterfall is an invaluable tool for pricing practitioners as they continuously analyze transaction health and make informed recommendations on price changes. It can also be valuable to understand the net profitability of a given customer.

Driver Analysis
Margin driver analysis and revenue driver analysis both allow pricing teams and business leaders to determine how price, volume, cost and mix are contributing to (or detracting from) margin performance.
“The number one thing we talk about with our customers is the Driver Analysis,” said Nathan Rabold, vice president of customer success at Zilliant.
“It paints the picture of what has changed in the business as well as what’s driving that change. If we increased price, did we lose volume? How well did we pass through costs? How much margin growth came from price? These are just a few of the valuable data points we can derive.”
Read more: What Makes Zilliant Customers Successful
Zilliant’s Driver Analysis pinpoints the trends and isolates the specific factors that impact margin or revenue. For pricing teams, this foundational understanding of cause-and-effect is a prerequisite to making better commercial decisions. Especially in a business that produces massive amounts of transaction data, the ability to ingest all that data and clearly demonstrate actual performance via intuitive waterfall charts is extremely powerful. Driver Analysis provides the basis for recommending a change in strategy during regular price performance review cycles.
If a pricing analyst sees that a product line's revenue has grown year-over-year but margin has decreased, he or she can investigate why this happened with a few clicks instead of spending time on spreadsheets or custom code.
In this case, the user may discover that while procurement secured lower costs, the business gave away most of those savings when it came to price. Maybe there was also a mix shift to lower margin SKUs. This valuable insight can be shared with executives and sales reps can be guided to quoting higher margin products.
From an executive perspective, Driver Analysis lays out a roadmap for change at the product, customer or region level. A glance at the analytics might reveal a particular branch office is hurting margins by consistently overriding prices or creating special price exceptions. This may highlight the need for more training on price adoption or illuminate a specific competitive threat in that region.
Sales Rep & Customer Adoption Metrics
Another important type of descriptive pricing analytics comes in the form of what we might call behavioral analytics. How is a price change that we recently made being accepted by sales reps? Which sales regions are quoting the target prices most often, and within those regions, which individual reps are doing the best job?
From that insight, management can highlight and reward positive pricing behaviors and hold underperformers to account. Often, companies find value in producing sales leaderboards that tap into sellers’ innate competitiveness, motivating the team to adopt improved prices.
Pricing teams can also glean insight into how well customers are receiving price increases. If a recent price change is followed rapidly by an uptick in price exception requests, perhaps that price increase needs to be amended.
Predictive Analytics (Forward-looking)
Predictive analytics allow pricing teams to leverage historical pricing and transaction data to project into the future. For companies that are not using predictive pricing analytics, critical processes are left to chance and guesswork. While no person or piece of software can perfectly predict the future, it is possible to be reasonably sure how planned price changes – due to cost fluctuations, competitive campaigns, raw material shortage, etc. – will impact financial performance.
Predictive Pricing Analytics Examples
Price Optimization and Forward-looking P&L Impact
The ability to measure price elasticity is foundational to setting optimized prices and understanding the predicted impact of those prices before putting them in market. Price elasticity measurement allows you to mathematically derive the revenue maximizing and profit maximizing price points for any pricing microsegment of your business. From there, you can run what-if scenarios using different pricing strategies and predict the volume, margin and revenue impact of those strategies, drilling down to specific products, customers or slices of the business.
Listen: B2B Reimagined Episode #48 – Yes, You Can Measure Price Elasticity in B2B
Zilliant Price IQ® provides companies with this capability and the predictive analytics to understand the expected financial outcomes. This approach to price optimization allows data scientists and pricing analysts to test out strategies at different levels of revenue- or profit-aggressiveness and visualize the impact prior to pushing through a price change to understand its full ramifications.
Read more: A close cousin to pricing analytics: predictive sales analytics
Prescriptive Analytics (Decision Support)
If predictive analytics predict the opportunities that exist in your business, prescriptive analytics suggest the specific actions you must take to turn those predictions into reality.
Most often consumed by executives and sales team members, prescriptive pricing analytics go beyond predicting to direct concrete next steps to achieve P&L goals.
Prescriptive Pricing Analytics Examples
Contextual Pricing Analytics
When presented with a target price, or negotiation guidance, it is often helpful to provide some additional context to the sales rep showing why that price is relevant in that given selling circumstance. By giving sales reps embedded pricing analytics in their quoting or order entry tool, they can feel confident in their pricing decision because they understand the rationale as to how one customer’s recommended price makes sense relative to peers in that same pricing segment.
Money Map
Sales reps likely do not need in-depth analytics, rather it’s best to only provide the level of information they need to be effective when and where they need it. This often takes the form of an in-the-moment view of simple analytics that tell them exactly what actions to take with a specific customer or prospect.
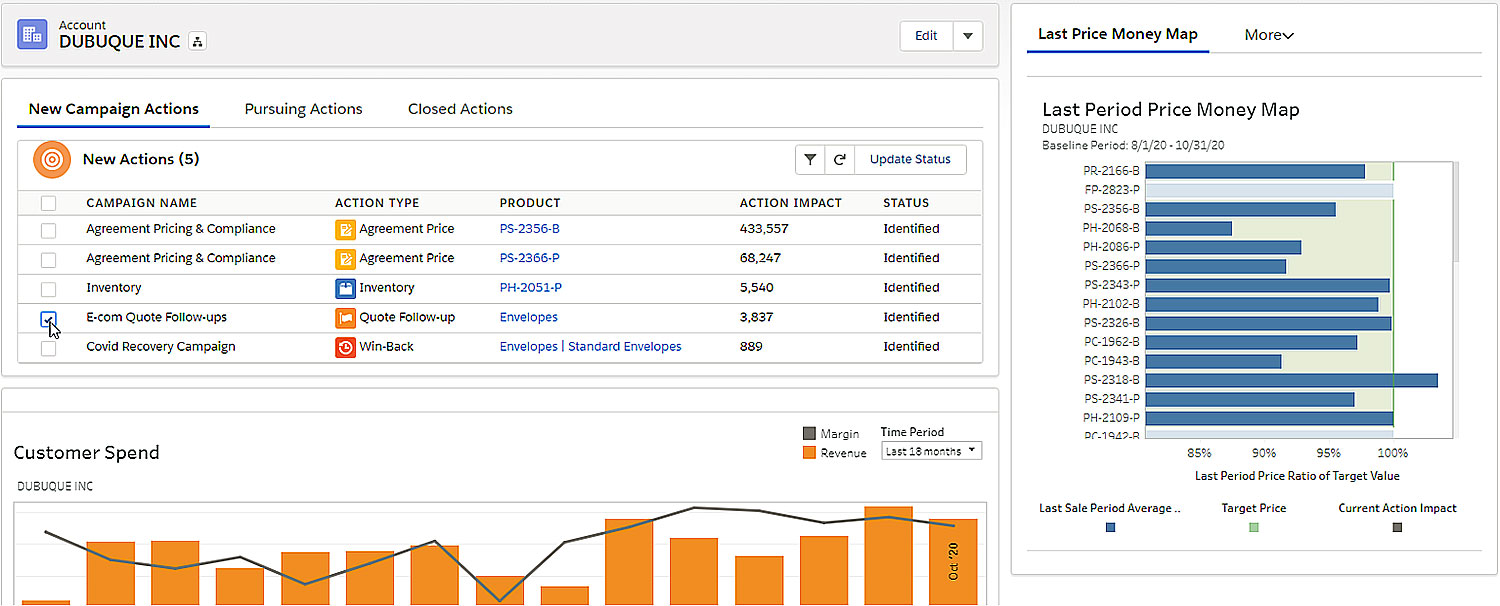
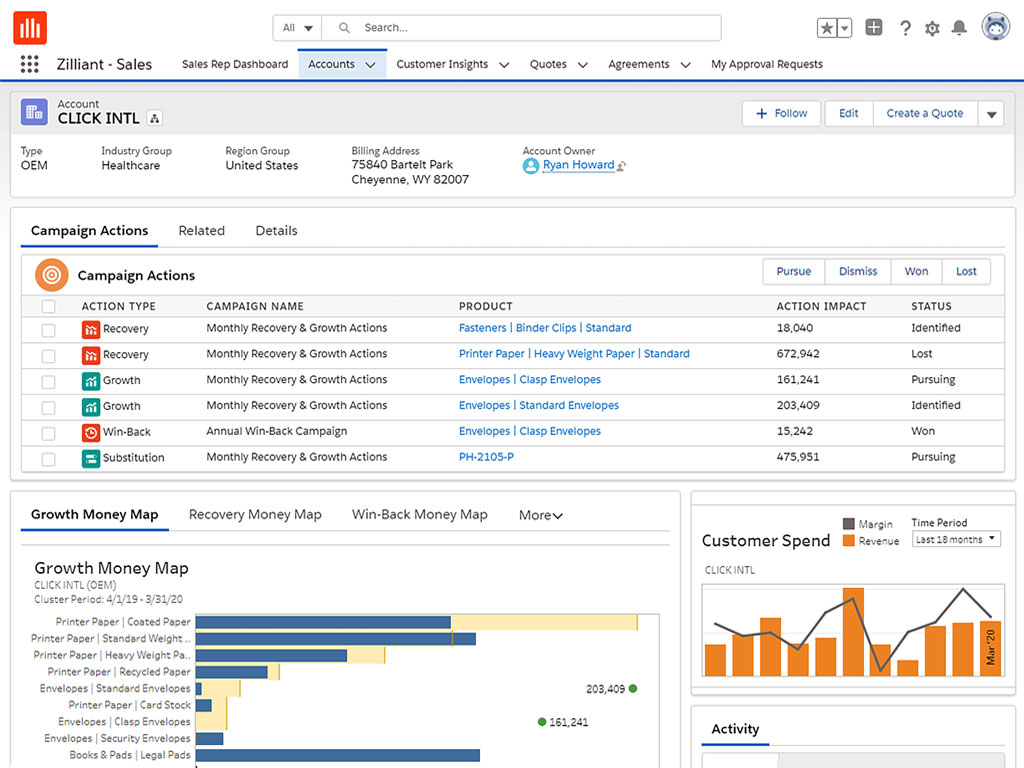
A money map is a type of visual analytics delivered directly to a salesperson’s CRM or other sales productivity tool that highlights what additional products a customer should be buying, in what proportion and often at what price.

These embedded analytics show the simple actions a sales rep should take with a customer that will lead to growth of revenue or margin with each account. For example, these analytics can pinpoint when a customer’s agreement price is below acceptable levels, or when it is advisable to sell a substitute higher-margin, lower-price product. Money maps are also useful as coaching tools for sales reps and sales managers alike.

Conclusion
Modern pricing analytics tools allow pricing analysts, data scientists, sales reps, and executive leaders to quickly get the answers and decision guidance they need to positively impact the top- and bottom-line.
When seeking out a pricing software vendor, be sure to vet whether they have a comprehensive approach to pricing analytics built on technology that offers easy, self-service configuration of reports and can handle large amounts of data. Scale and ease of use are paramount to getting the most out of pricing analytics.


